


 – Reports All-Time High Annual Net Profit of Rs. 1252 Crore")


19 May 2017,Kolkata :-
State Bank of India (SBI) declared their financial figures here today with a super perfomence despite of demonetization and impact of global financial slowdown.
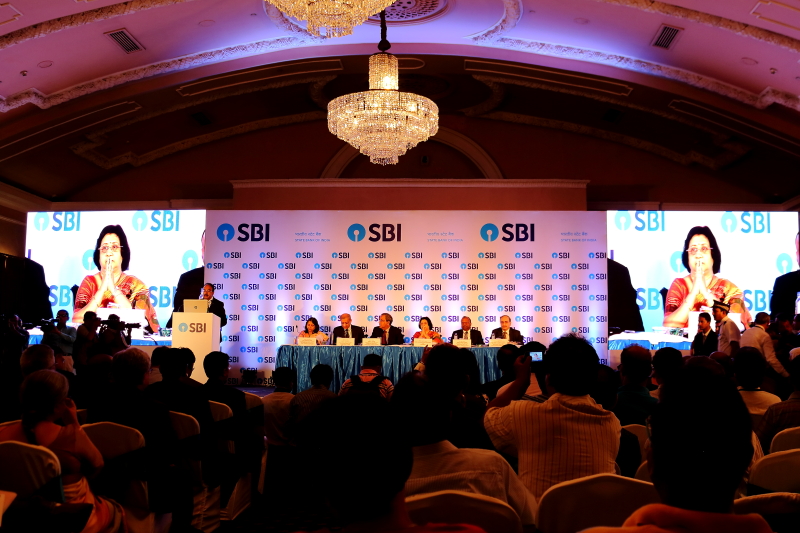
When the chairman of SBI Madam Arundhati Bhattacharjee enter the stage it was clear from the faces that SBI is rocking in numbers. A full house of Press at Kolkata with counters joining from Mumbai over video conference made it a grand meet to know SBI vital stats.
SBI Chairman is confident that by next couple of years SBI will grow further and consolidate the market and portfolios to become the most important financial institute not only in India but also at global level.
Increase in CASA ration and decrease in Net NPA % makes a much healthy sign with over all Asset quality improved from Q3-2016.
SBI STAND ALONE RESULTS
Q4FY17 OVER Q4FY16
HIGHLIGHTS
- Net Profit increased by 122.72% from Rs.1,264 Cr in Q4FY16 to Rs.2,815 Cr in Q4FY17.
- Operating Profit increased by 12.93% from Rs.14,192 Cr in Q4FY16 to 16,026 Cr in Q4FY17.
- Net Interest Income increased by 17.33% from Rs.15,401 Cr in Q4FY16 to Rs.18,071 Cr in Q4FY17.
- Non-Interest Income decreased marginally by 2.43% from Rs.10,585 Cr in Q4FY16 to Rs.10,327 Cr in Q4FY17. The major contributors were Profit on Sale of Investments, Fee Income, Forex Income and Recovery in Written-Off Accounts.
- Fee Income increased by 4.91% from Rs.5,794 Cr in Q4FY16 to Rs.6,078 Cr in Q4FY17.
- Operating Income increased by 9.28% from Rs.25,986 Cr in Q4FY16 to Rs.28,398 Cr in Q4FY17.
PROFITABILITY
- Total Interest Income increased by 10.36% from Rs.42,942 Cr in Q4FY16 to Rs.47,393 Cr in Q4FY17.
- Interest Income on Advances increased from Rs.29,242 Cr in Q4FY16 to Rs.29,861 Cr in Q4FY17 (2.12%). The lower growth is mainly due to reduction in Base Rate / MCLR during the period.
- Interest Income on Resources Operations increased from Rs.11,113 Cr in Q4FY16 to Rs.14,395 Cr in Q4FY17 (29.53%).
- Total Interest Expenses increased from Rs.27,541 Cr in Q4FY16 to Rs.29,322 Cr in Q4FY17 (6.47%).
- Interest Expenses on Deposits increased from Rs.25,103 Cr in Q4FY16 to Rs.27,264 Cr in Q4FY17 (8.61%).
- Operating Expenses increased from Rs.11,794 Cr in Q4FY16 to Rs.12,372 Cr in Q4FY17 (4.89%).
- Staff Expenses decreased from Rs.6,943 Cr in Q4FY16 to Rs.6,242 Cr in Q4FY17 (-10.09%).
- Overheads increased from Rs.4,852 Cr in Q4FY16 to Rs.6,130 Cr in Q4FY17 (26.34%).
FY17 OVER FY16
- Operating Profit increased from Rs.43,258 Cr in FY16 to Rs. 50,848 Cr in FY17 (17.55% YOY growth)
- Interest Income on Advances increased from Rs.1,15,666 Cr in FY16 to Rs.1,19,510 Cr in FY17 (3.32%YOY growth).
- Interest Income on Resources Operations increased from Rs.42,925 Cr in FY16 to Rs.49,959 Cr in FY17 (16.39%YOY growth).
- Interest Expenses on Deposits increased from Rs.98,865 Cr in FY16 to Rs.1,05,599 Cr in FY17 (6.81%YOY growth).
- Non-Interest Income increased from Rs.27,845 Cr in FY16 to Rs.35,461 Cr in FY17 (27.35%YOY growth).
- Fee Income increased from Rs.15,658 Cr in FY16 to Rs.17,803 Cr in FY17 (13.70% YOY growth)
- Staff Expenses increased from Rs.25,114 Cr in FY16 to Rs.26,489 Cr in FY17 (5.48%YOY growth).
- Overheads increased from Rs.16,669 Cr in FY16 to Rs.19,983 Cr in FY17 (19.89%YOY growth).
- Operating Expenses increased from Rs 41,782 Cr in FY16 to Rs.46,473 Cr in FY17 (11.23% YOY growth).
- Net Profit increased by 5.36% from Rs.9,951 Cr in FY16 to Rs.10,484 Cr in FY17.
DEPOSITS
- Deposits of the Bank increased from Rs.17,30,722 Cr as on Mar 16 to Rs.20,44,751 Cr as on Mar 17 (18.14%.YOY growth)
- Savings Bank Deposits increased from Rs.5,81,564 Cr as on Mar 16 to Rs.7,43,286 Cr as on Mar 17 (27.81% YOY growth).
- Current Account Deposits increased from Rs.1,35,768 Cr as on Mar 16 to 1,47,123 Cr as on Mar 17 (8.36% YOY growth).
- CASA Deposits increased from Rs.7,17,332 Cr as on Mar 16 to Rs.8,90,409 Cr as on Mar 17 (24.13% YOY growth).
- Market Share in Deposits improved by 38 bps from 17.67% in Mar 16 to 18.05% as on Mar 17.
ADVANCES
- Gross Advances increased from Rs.15,09,500 Cr as on Mar 16 to Rs.16,27,273 Cr as on Mar 17 (7.80% YOY growth).
- Large Corporate Advances increased from Rs.3,30,136 Cr as on Mar 16 to Rs.3,41,990 Cr as on Mar 17 (3.59% YOY growth).
- Mid Corporate Advances stable at Rs.2,42,947 Cr as on Mar 17 as against Rs.2,42,443 Cr as on Mar 17 (0.21% YOY growth)
- Retail Advances increased from Rs.3,26,988 Cr as on Mar 16 to Rs.3,96,239 Cr as on Mar 17 (21.18% YOY growth). Home loans increased from Rs.1,90,552 Cr as on Mar 16 to Rs.2,22,605 Cr as on Mar 17 (16.82% YOY growth).
- SME Advances increased from Rs.2,17,735 Cr as on Mar 16 to Rs.2,25,153 Cr as on Mar 17 (3.41% YOY growth).
- Agri Advances increased from Rs.1,25,381 Cr as on Mar 16 to Rs.1,34,725 Cr as on Mar 17 (7.45% YOY growth).
- International Advances increased from Rs.2,66,817 Cr as on Mar 16 to Rs.2,86,219 Cr as on Mar 17 (7.27% YOY growth).
ASSET QUALITY:
| Gross NPA (%) | Net NPA (%) | PCR(%) | |
| Mar 16 | 6.50 | 3.81 | 60.69 |
| June 16 | 6.94 | 4.05 | 61.57 |
| Sep 16 | 7.14 | 4.19 | 62.12 |
| Dec 16 | 7.23 | 4.24 | 62.87 |
| Mar 17 | 6.90 | 3.71 | 65.95 |
- Gross NPAs increased from 98,173 Cr as on Mar 16 to Rs.1,12,343 Cr as on Mar 17.
KEY FINANCIAL RATIOS (SBI):
- Return on Equity declined by 49 bps to 7.25% as on Mar 17 from 7.74% as on Mar 16 and by 21 bps sequentially.
- Return on Assets declined marginally by 5 bps from 0.46% as on Mar 16 to 0.41% as on Mar 17, while sequentially it remained stable.
- Average Cost of Deposits declined by 43 bps from 6.22% as on Mar 16 to 5.79% as on Mar 17 and by 7 bps sequentially from 5.86% as on Dec 16.
- Average Yield on Advances declined by 58 bps from 10.00% as on Mar 16 to 9.42% as on Mar 17 and by 4 bps sequentially from 9.46% as on Dec 16.
- Cost to Income Ratio declined by 138 bps YOY from 49.13% as on Mar 16 to 47.75% as on Mar 17 and by 173 bps sequentially from 49.48% as on Dec 16.
- CASA Ratio was healthy at 45.58% as on Mar 17, which increased from 43.84% as on Mar 16, a growth of 174 bps. The average CASA Ratio was at 43.49% as on Mar 17.
- Net Interest Margin (Domestic) declined by 16 bps YOY to 3.11% as on Mar 17 from 27% as on Mar 16 and increased by 8 bps sequentially from 3.03% as on Dec 16.
Performance of SBI Group:
- Gross NPA Ratio for SBI Group increased from 6.40% as on Mar 16 to 9.04% as on Mar 17, while Net NPA Ratio increased from 3.73% as on Mar 16 to 5.15% as on Mar 17.
- Net Profit (after minority interest) of SBI Group declined from Rs.12,225 Cr in FY16 to Rs.241 Cr in FY17.
===============
ANNEXURE
Details of Profit and Loss account for standalone are as follows: Rs. in Crores
| 2015-16 | 2016-17 | Growth FY17 Over FY16 | Growth Q4FY17 Over Q4FY16 | |||
| Q4 | FY16 | Q4 | FY17 | % | % | |
| Interest on Advances | 29242 | 115666 | 29861 | 119510 | 3.32 | 2.12 |
| Int on Resources Operations | 11113 | 42925 | 14395 | 49959 | 16.39 | 29.53 |
| Others Sundry Interest income | 2586 | 5407 | 3137 | 6049 | 11.88 | 21.28 |
| Total Interest Income | 42942 | 163998 | 47393 | 175518 | 7.02 | 10.36 |
| Interest on Deposits | 25103 | 98865 | 27264 | 105599 | 6.81 | 8.61 |
| Interest on Borrowings | 1427 | 4154 | 1000 | 3837 | -7.63 | -29.94 |
| Others Sundry Interest paid | 1011 | 3784 | 1058 | 4222 | 11.58 | 4.68 |
| Total Interest Expenses | 27541 | 106803 | 29322 | 113659 | 6.42 | 6.47 |
| Net Interest Income | 15401 | 57195 | 18071 | 61860 | 8.16 | 17.33 |
| Non-Interest Income | 10585 | 27845 | 10327 | 35461 | 27.35 | -2.43 |
| Operating Income | 25986 | 85040 | 28398 | 97321 | 14.44 | 9.28 |
| Staff Expenses | 6943 | 25114 | 6242 | 26489 | 5.48 | -10.09 |
| Overhead Expenses | 4852 | 16669 | 6130 | 19983 | 19.89 | 26.34 |
| Operating Expenses | 11794 | 41782 | 12372 | 46473 | 11.23 | 4.89 |
| Operating Profit | 14192 | 43258 | 16026 | 50848 | 17.55 | 12.93 |
| Income Tax Provisions | -246 | 3823 | 1472 | 4371 | 14.32 | |
| Loan Loss Provisions | 12139 | 26984 | 10993 | 32247 | 19.50 | -9.44 |
| Investment Depreciation | -6 | 150 | 78 | 298 | 99.52 | |
| Standard Assets Provision | 996 | 2158 | 289 | 2500 | 15.86 | -70.96 |
| Other Provisions | 45 | 192 | 380 | 948 | ||
| Total Provisions | 12928 | 33307 | 13212 | 40364 | 21.19 | 2.19 |
| Net Profit | 1264 | 9951 | 2815 | 10484 | 5.36 | 122.72 |
*** Source SBI Report


