


Explainer Note on National Multidimensional Poverty Index
National Multidimensional Poverty Index: Baseline Report based on NFHS-4 (2015-16)
By PIB Delhi
1. Under the Cabinet Secretary’s Global Indices for Reforms and Growth (GIRG) initiative, the country’s performance is being monitored across 29 global indices including Human Development Index (HDI), Global Hunger Index (GHI), Global Competitiveness Index (GCI), Human Capital Index (HCI), Global Innovation Index (GII), among others. This exercise is aimed at leveraging the monitoring mechanism of important social, economic, and other internationally recognised indices, enabling the utilisation of these indices as tools for bringing about reforms to improve outcomes and correspondingly reflect them in India’s performance in these indices globally. Under this initiative, NITI Aayog is the nodal Ministry for the Multidimensional Poverty Index (MPI). According to Global MPI 2021, India’s rank is 66 out of 109 countries. The National MPI Project is aimed at deconstructing the Global MPI and creating a globally aligned and yet customised India MPI for drawing up comprehensive Reform Action Plans with the larger goal of improving India’s position in the Global MPI rankings. As the nodal Ministry for MPI, NITI Aayog is also responsible for engaging with the publishing agencies of the index; ranking States and Union Territories based on their performance and has also constituted an inter-ministerial MPI Coordination Committee (MPICC) to consult twelve Line Ministries mapped to each National MPI indicator.
2. National Multidimensional Poverty Index: Baseline Report based on NFHS-4 (2015-16) has been developed by NITI Aayog in consultation with 12 Line Ministries and in partnership with State governments and the index publishing agencies –Oxford University’s Oxford Poverty and Human Development Initiative (OPHI) and United Nations Development Programme (UNDP).
3. National Multidimensional Poverty Index: Baseline Report is based on National Family Health Survey 4, which was conducted in 2015-16. NFHS is conducted by the International Institute for Population Sciences (IIPS) under the Ministry of Health and Family Welfare, Government of India.
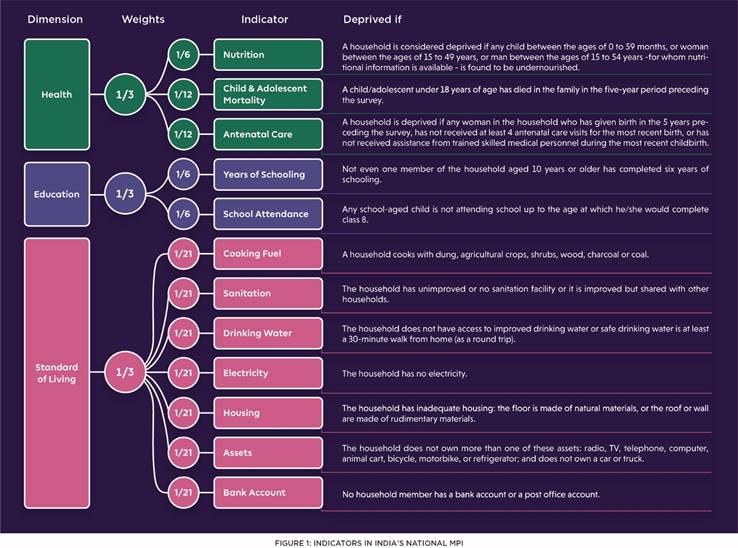
4. National Multidimensional Poverty Index: Baseline Report based on NFHS-4 (2015-16) is a contribution towards measuring progress towards target 1.2 of the Sustainable Development Goals (SDGs) which aims at reducing “at least by half the proportion of men, women and children of all ages living in poverty in all its dimensions”. Across three dimensions of health, education and standard of living, it includes indicators on nutrition, child and adolescent mortality, maternal care, years of schooling, school attendance, cooking fuel, sanitation, drinking water, electricity, housing, bank accounts and assets.
5. NFHS 4 (data period: 2015-16), precedes the full roll out of flagship schemes on housing, drinking water, sanitation, electricity, cooking fuel, financial inclusion, and other major efforts towards improving school attendance, nutrition, mother and child health, etc. Hence it serves as a useful source for measuring the situation at baseline i.e. before large-scale rollout of nationally important schemes. Pradhan Mantri Awas Yojana (PMAY), Jal Jeevan Mission (JJM), Swachh Bharat Mission (SBM), Pradhan Mantri Sahaj Bijli Har Ghar Yojana (Saubhagya), Pradhan Mantri Ujjwala Yojana (PMUY), Pradhan Mantri Jan Dhan Yojana (PMJDY), POSHAN Abhiyaan and Samagra Shiksha are some of those schemes and programmes.
6. The household microdata collected at the unit-level for the NFHS serves as the basis of the computation of National MPI. This unit level micro data collected in 2015-16 has been used in the current MPI report to derive an idea of baseline multidimensional poverty i.e. where the country was with respect to MPI before full-scale roll out of the above mentioned schemes. The progress of the country with respect to this baseline will be measured using the NFHS-5 data collected in 2019-20. The NFHS 5 2019-20 summary fact sheets for all States and Union Territories was released by IIPS and MoHFW on 24 November 2021. National MPI based on NFHS 5 of the data period 2019-20 will be computed when the unit level micro data for the same is released by IIPS and MoHFW next year.
7. Preliminary observations from the summary data factsheets of NFHS 5 (2019-20) are encouraging. They suggest improvement in access to clean cooking fuel, sanitation, and electricity which translates to reduction in deprivation. Additionally, the State reports released for 22 States and UTs suggest reduction in deprivation in school attendance, drinking water, bank accounts and housing. These improvements indicate an overall direction of significant reduction in the incidence of multidimensional poverty in the forthcoming index based on NFHS 5 (2019-20) household micro data.
8. Substantive gains achieved through focussed programmatic interventions and flagship schemes since NFHS 4 (2015-16) is reflected in the NFHS 5 (2019-20) factsheets and reports for indicators under the purview of the National MPI. The progress report, a follow-up to the baseline National MPI report, will capture this reduction in multidimensional poverty between 2015-16 (NFHS 4) and 2019-20 (NFHS 5). This report will be released after the unit level micro data of NFHS 5 is available.
National MPI (based on National Family Health Survey-4, data period- 2015-16): Dimensions, Indicators and Findings
- India’s national MPI captures multiple and simultaneous deprivations faced by households across the three macro dimensions of health, education and living standards. The National MPI dimensions, indicators and weights are given below:
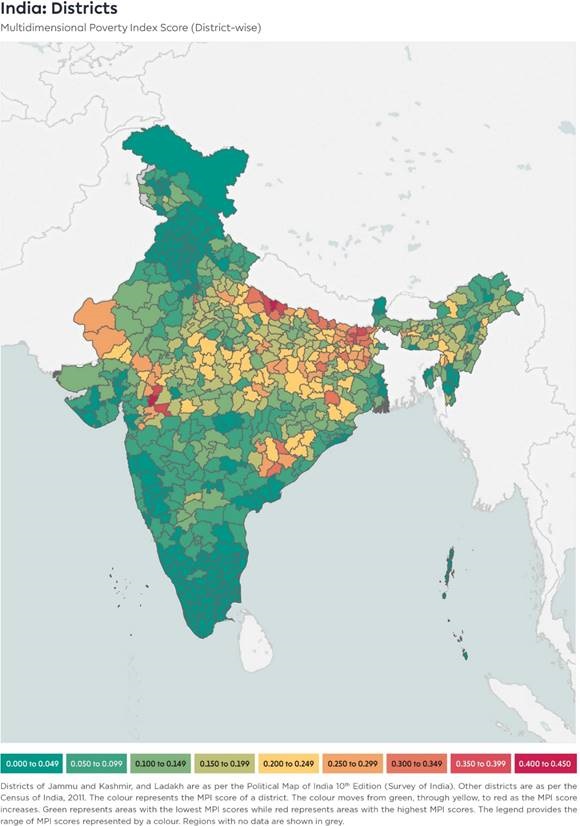
- Estimates of national MPI headcount ratio and intensity have been furnished not only for the States and Union Territories but also for all the districts, which is a unique feature of this report. This will not only enable the analysis of comparative and relative performance among States and UTs but also among the districts of a State. This assumes salience given the federal structure of the country and the importance of the involvement of district administrations for effective implementation of interventions and schemes.
Figure 2: Headcount Ratio (% of population who are MPI poor)
The States are depicted in ascending order of their respective MPI headcount ratio below:
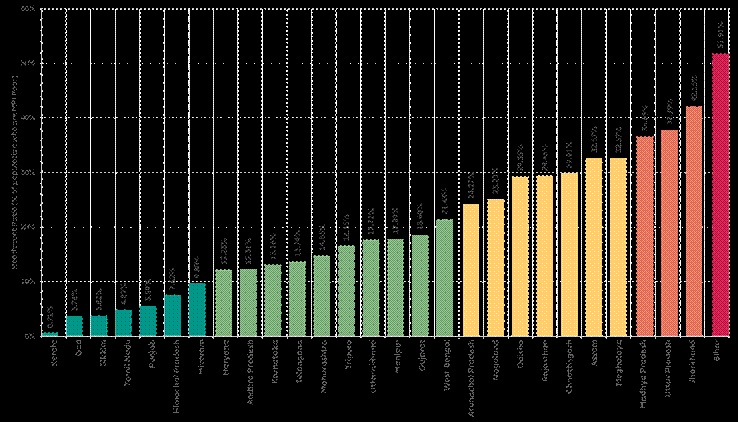
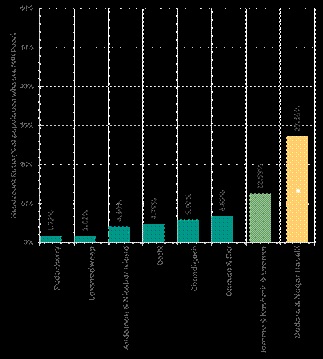
Figure 3:
Positive trends in NFHS 5 (data period- 2019-20): Preliminary observations from NFHS factsheets and reports
- Indicators on nutrition, child & adolescent mortality, maternal health, years of schooling and assets can only be computed after the NFHS 5 (2019-20) household level micro data is released by IIPS and MoHFW. The MPI score is computed by scoring each sampled household in a given State or district on all 12 indicators simultaneously. Therefore, it requires the household unit level microdata of the NFHS.
- Preliminary estimates on electricity, cooking fuel and sanitation indicators are available for all 36 States and Union Territories in the NFHS 5 (2019-20) factsheets released by IIPS and MoHFW on 24 November 2021.
- Preliminary estimates on school attendance, drinking water, housing, and bank accounts is available in the State Reports of NFHS 5 (2019-20) for 22 States and UTs only.
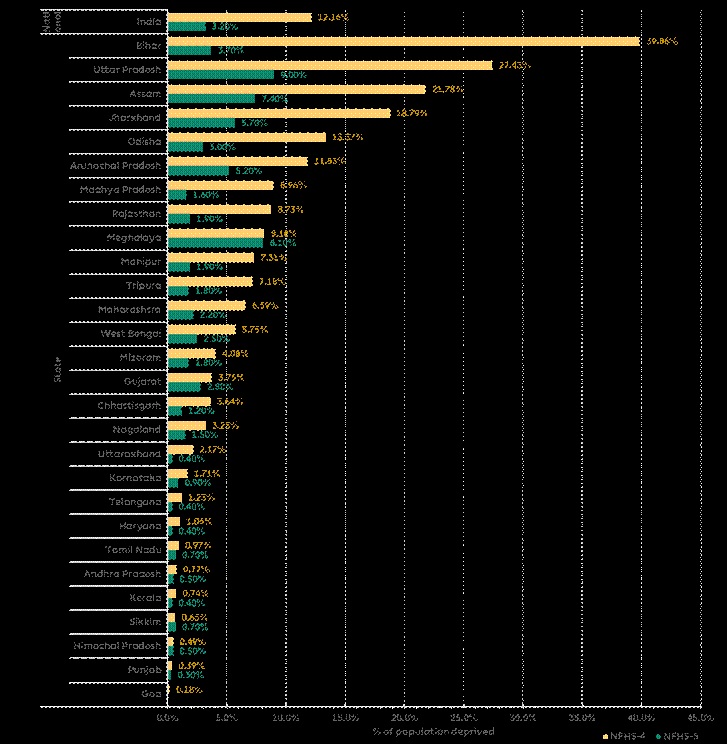
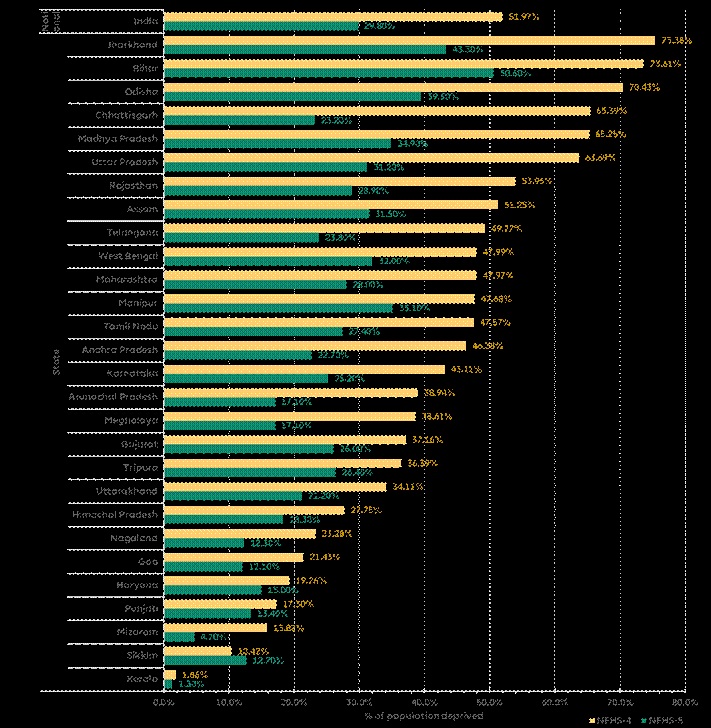
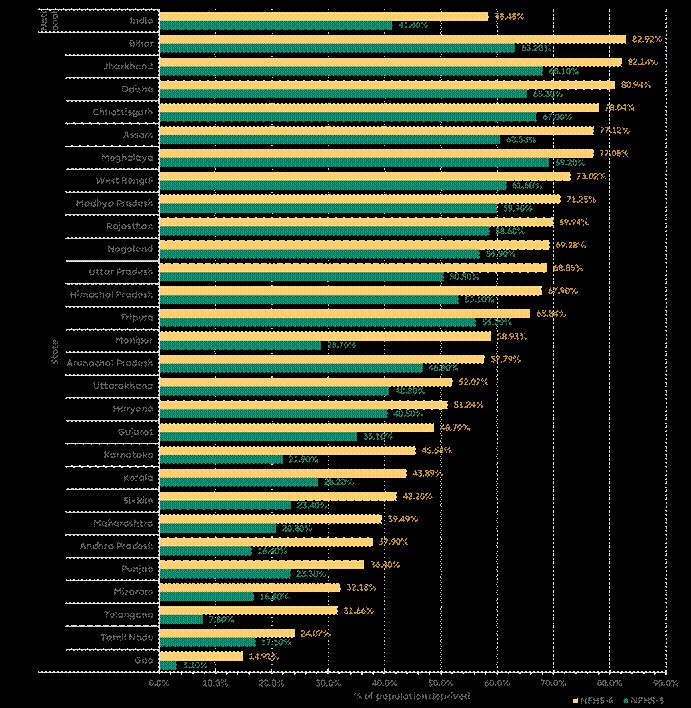
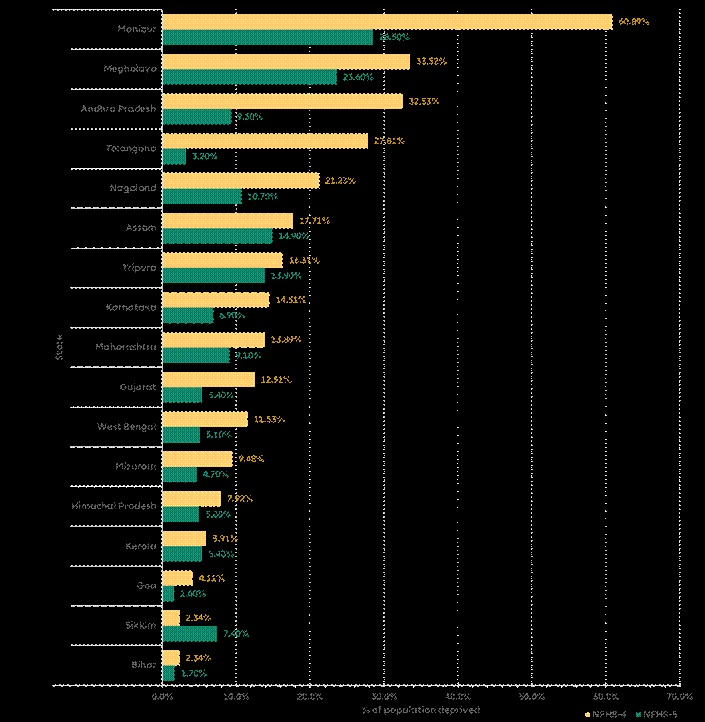
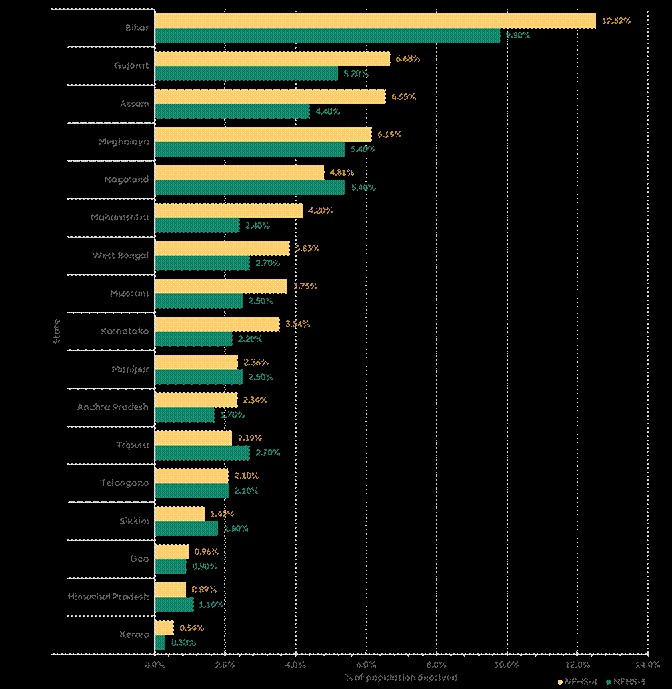
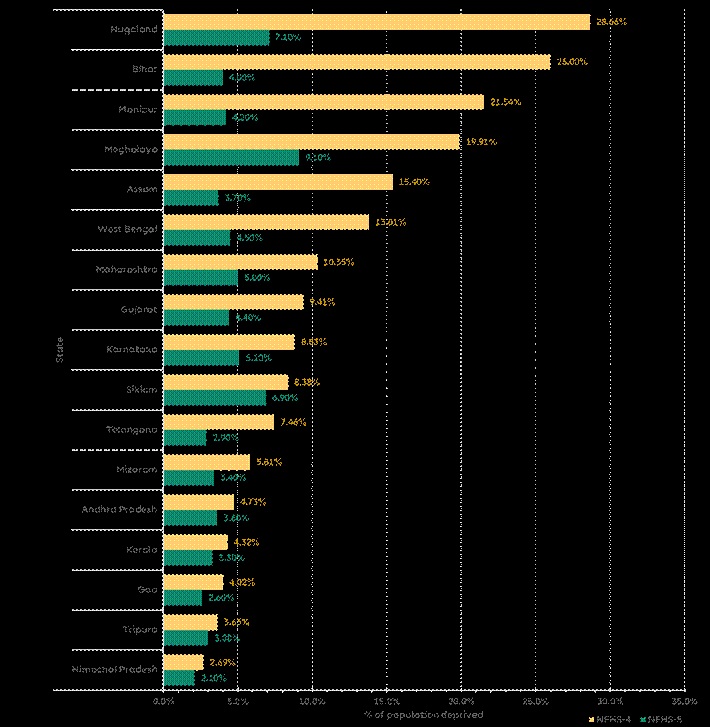
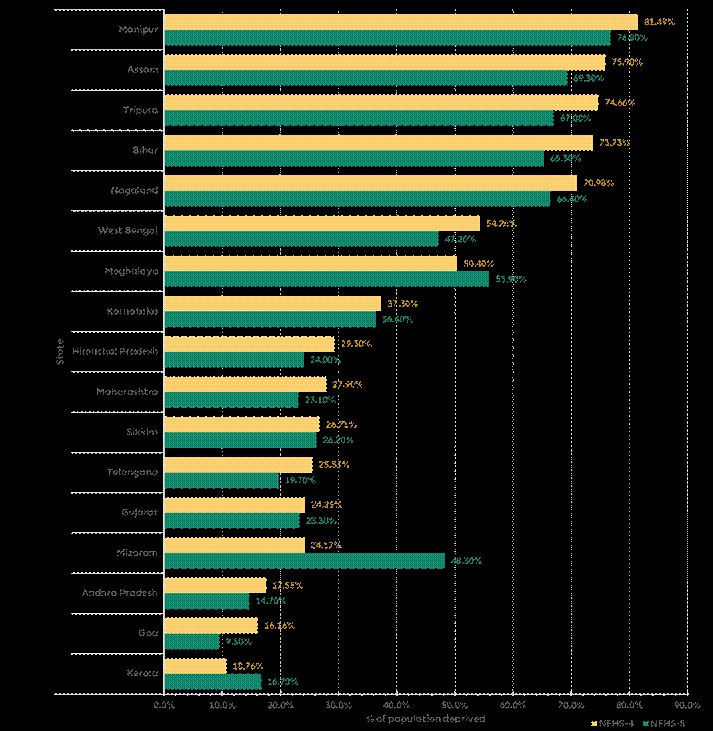
- The yellow bars in the graph below denote the percentage of population deprived in an indicator of the National MPI in 2015-16 (NFHS 4). The green bar denotes the percentage of population deprived in an indicator in 2019-20 (NFHS 5).
- Deprivation =100 – achievement in a particular indicator. For example: if population living in households with electricity =99%, then deprivation = 1%
- Positive trends in NFHS 5 (2019-20) in reducing deprivation in electricity (NFHS 4 2015-16 in yellow and NFHS 5 2019-20 in green)
- Positive trends in NFHS 5 (2019-20) in reducing deprivation in improved and exclusive sanitation (NFHS 4 2015-16 in yellow and NFHS 5 2019-20 in green)
- Positive trends in NFHS 5 (2019-20) in reducing deprivation in using clean fuel for cooking (NFHS 4 2015-16 in yellow and NFHS 5 2019-20 in green)
- Positive trends in NFHS 5 (2019-20) in reducing deprivation in drinking water (NFHS 4 2015-16 in yellow and NFHS 5 2019-20 in green)
- Positive trends in NFHS 5 (2019-20) in reducing deprivation in elementary school attendance (NFHS 4 2015-16 in yellow and NFHS 5 2019-20 in green)
- Positive trends in NFHS 5 (2019-20) in reducing deprivation in bank accounts (NFHS 4 2015-16 in yellow and NFHS 5 2019-20 in green)
- Positive trends in NFHS 5 (2019-20) in reducing deprivation in housing (NFHS 4 2015-16 in yellow and NFHS 5 2019-20 in green)
*The MPI defines an individual to be deprived in housing if they are living in a kachha or semi-pucca house as defined by the NFHS-5.


